We deliver timely, personalized insights at scale. Now introducing ChatGPT Insights!

Stories combining:


Schedule publication to the web or email, conditional on data availability or thresholds. Optionally first send to editors for review and improvement.
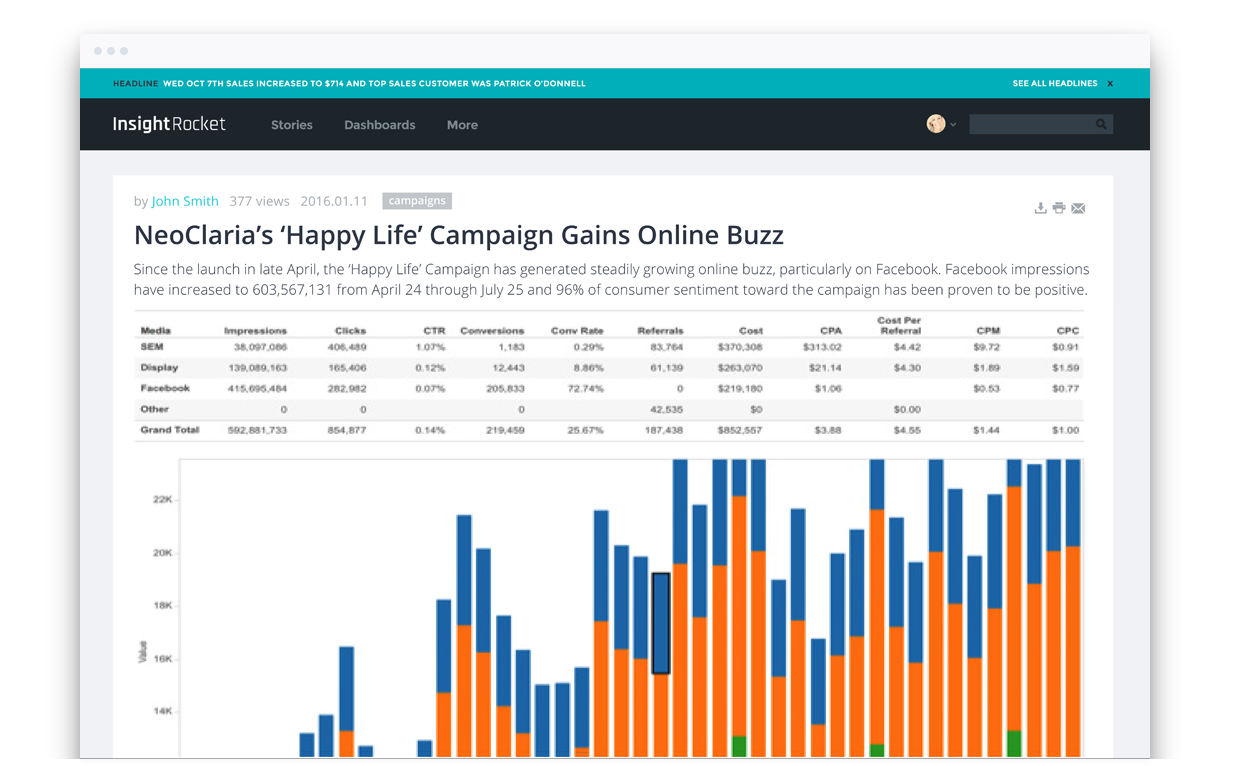
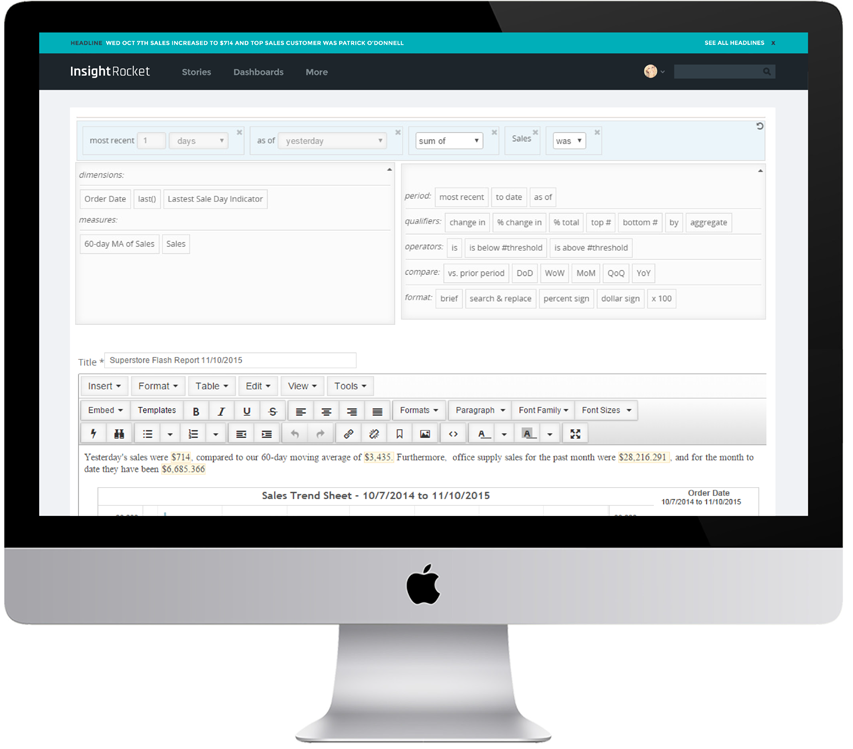
Dynamic data sourced from any Tableau worksheet, inserted anywhere within your narrative. Interactive vizes and other content dynamically included based on thresholds.
Dynamically created headlines published when data conditions are met and including your latest data. Visible on the portal or via email subscription.

No need for Tableau Desktop or training. Easily tell stories including interactive vizes via an intuitive blogging interface.
Story-level checkout and access control. Optionally share authorship by role. Version compare and restore.
One-click inline emails to colleagues of modified vizes. Email recipients can interact from where the sender left off.

Enable team members without Tableau skills to tell interactive, data-driven reports and stories.
Instantly publish stories to the web, mobile-friendly emails, PDFs, Word and PowerPoint.
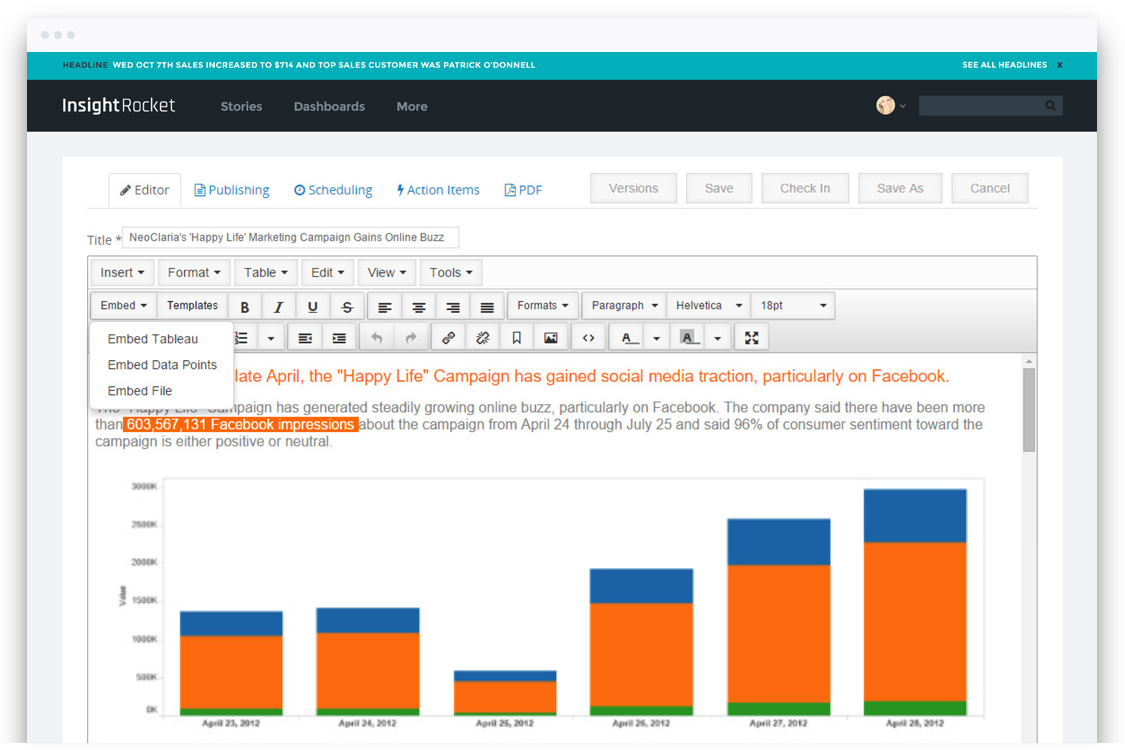
Embed dynamic data points from Tableau visualizations anywhere within your narrative.
Expand your analytics audience with executive portals, newsletters and headlines.
Save time with automated stories and reports that vary based on flexible data thresholds.
Encourage dialogue and collaboration with email-based commenting, ratings, and more.
Easily weave together text, interactive vizes, images and non-Tableau content into a story.